Your metrics have dates. DAGsight now uses them to tell cause from effect.
The arrow your weekly report can't draw
You have a table most marketing teams have: one row per day, with columns for ad_spend, site_visits, signups and revenue. All four go up together in good months and down together in quiet ones. Someone asks whether spend drives visits, or whether the team simply spends more when traffic is already climbing.
From the numbers alone, that question is often harder than it looks. As we explained in how causal discovery works for analysts, observational data can find which metrics are linked long before it can say which way the link runs. Many links come back as plain lines, not arrows, because the data genuinely can't pick a direction.
But a daily table carries one extra piece of information that a customer table doesn't: the order of the rows. Yesterday came before today. Today can't change yesterday. DAGsight now uses that.
What changed
There are two parts, and both happen automatically when you upload a CSV.
1. Calendar columns are treated as time
If your file has a column like month, week, quarter or a date, DAGsight now treats it as time, not as one more metric. Nothing in your data can cause the calendar, so any link involving that column always points away from it: month -> ad_spend is allowed, ad_spend -> month is not.
Date strings such as 2025-01-05 are now read as dates. Before this change they were treated as a text category, which wasn't useful.
Not every date-like column gets this treatment, on purpose. A customer's signup_date or a duration like time_on_site can itself be caused by something else in your data (a campaign can make people sign up earlier, a better page can make them stay longer). Those stay ordinary variables.
2. Consecutive periods are compared with the previous one
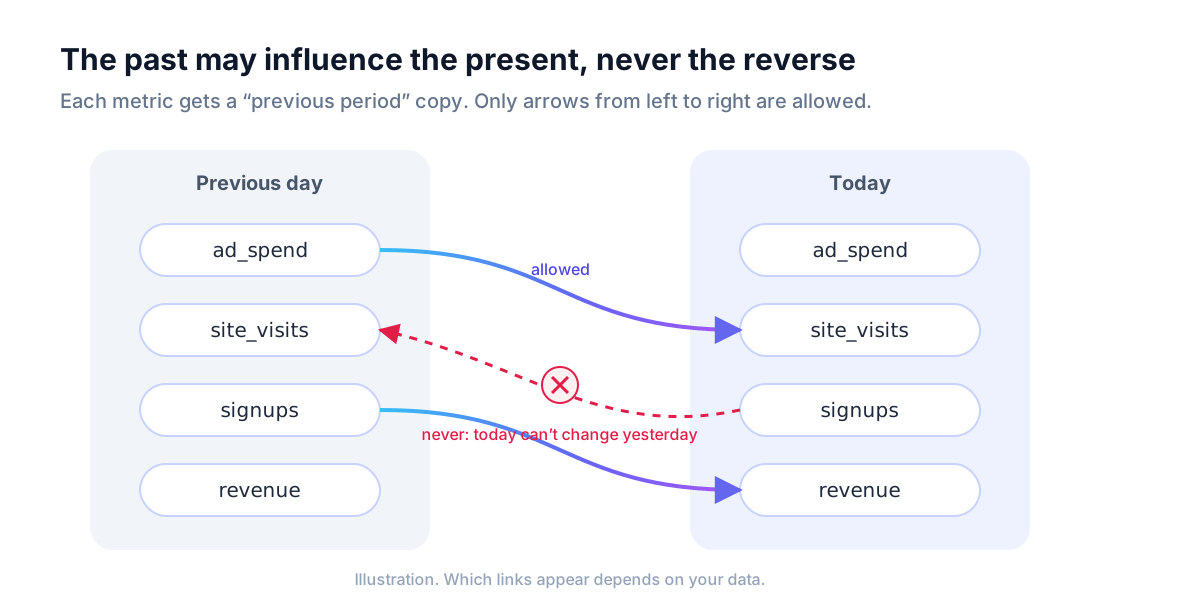
When your rows are consecutive periods (a date column with one row per date, and at least 50 rows), DAGsight also compares each period with the one before it. Each metric gets a "previous period" copy, and one rule applies: the past may influence the present, never the reverse.
On the result page this shows up as a new card, "Over time: what moves the next period", with links like:
ad_spend (previous period) -> site_visits
Read that as: higher ad spend on one day goes with more site visits the next day, in a way that the rest of your columns don't explain.
The comparison has a second benefit. Two metrics that both rise through the year will look strongly related even if neither affects the other. Once each metric's own past is in the picture, many of those links, which only reflect a shared trend, drop out.
Using time order as a source of direction isn't our invention. It is an old and well-studied idea in statistics and econometrics, going back at least to Granger (1969), with more recent work such as Runge et al. (2019). Both are cited as background on our assumptions page.
How well it works, and on what
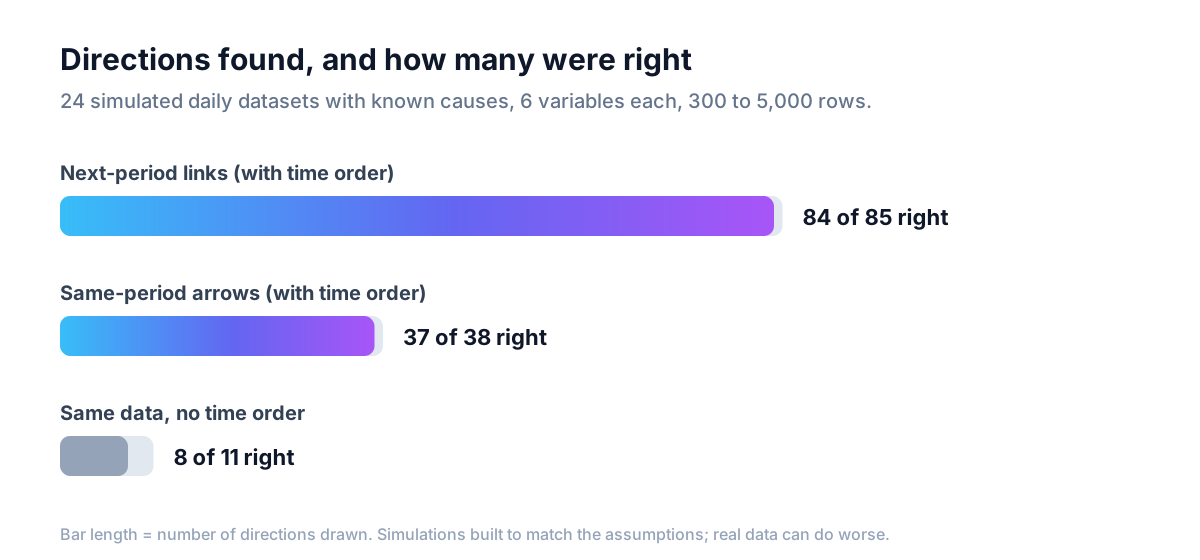
We measured this on simulated daily series where we wrote the causes ourselves, so the right answer was known before running anything: 24 datasets, 6 variables each, between 300 and 5,000 rows.
- Links from one period to the next: right 84 of 85 times.
- Arrows within the same period: right 37 of 38 times.
- The same data analysed without time order: right only 8 of 11 times, and it found far fewer directions overall.
On a separate seasonal example, adding the rule that the calendar can't be caused raised the number of correct arrows from 18 to 24, with no wrong ones added.
These are simulations, built to match the assumptions below. Real data can break those assumptions, and when it does the results will be worse. Our general accuracy statement doesn't change: on data simulated from models with known causes, about 90-100% of drawn arrows point the right way. What time order adds is more directions, decided on firmer ground. It does not turn a hypothesis into proof.
A live example you can open
We generated a synthetic daily marketing series: 500 days of email_sends, ad_spend, site_visits, signups and revenue. It is made-up data, not a customer's. You can open the full result without an account: see the example.
What it finds:
- Within a day:
email_sends -> site_visitsandsite_visits -> signups. - From one day to the next:
ad_spend -> site_visitsandsignups -> revenue. - One link without a direction:
ad_spend — revenue. The data didn't settle which way it runs, so it stays a plain line instead of a guessed arrow.
That last line is worth a second look. An undirected link is the tool saying "these are connected, and I can't tell you more from this data." Treat it as an open question, not a finding.
What it assumes
Every method that reads direction from data relies on assumptions. These are the ones that matter here:
- Causes act within one period or the next. If ad spend takes three weeks to show up in revenue on a daily table, that delay is only partly seen. If your effects are slow, try a weekly table instead of a daily one.
- No hidden factor drives both a past and a present value. If something you didn't record (a competitor's promotion, a news event) pushes on one metric yesterday and another today, it can show up as a link between them that isn't real.
- One row per date works best. If your file has several rows per date, say one per store per day, those rows are analysed as separate observations for now. Shared trends across stores can still create links that aren't causal. The "previous period" comparison only runs when there is one row per date.
- You need enough periods. The comparison needs at least 50 consecutive periods. More is better: a year of daily data is a much safer base than two months.
The full list, and the literature behind it, is on the assumptions and limits page.
How to use the result
Treat the "Over time" card as a shortlist, not a verdict. A link like ad_spend (previous period) -> site_visits says the timing and the numbers are consistent with spend driving visits. It does not prove it.
Before moving budget, confirm the top link with an experiment. The result page has a "What to A/B test next" block for exactly this step. For a link that runs from one day to the next, a simple version is to change spend on randomly chosen days or regions and compare the following day's visits.
Try it
If you have a daily or weekly metrics table, upload it as a CSV with one row per date and a date column. DAGsight will use the calendar and the order of your rows to decide more directions, show you what moves the next period, and leave a plain line wherever the data still can't decide. Free tier, no card: start free.