Categories and numbers in one table: how many rows do you need?
The question behind the upload
You export a table from your CRM or your operations system. Some columns are numbers: deal size, days to close, tickets per week, order value. Others are categories: region, sales rep, plan, channel, warehouse, month. You upload it, and a reasonable question comes up first: is this enough rows?
It depends less on how many columns you have and more on how many values your category columns have. Here is why, what we measured, and what to do before you upload.
Same effect everywhere vs. different effect per group
There are two kinds of relationships in a mixed table, and they need very different amounts of data.
The same effect in every group. Say a longer onboarding call goes with a higher renewal rate, and that holds roughly the same way in every region and on every plan. Every row in your file helps confirm it. This is the easy case. On mixed data shaped like a typical CRM export (50 columns, 21 of them categorical, 7,000 rows), DAGsight finds effects like this well.
A different effect per group. Now say the onboarding call matters a lot in one region and barely at all in another, and differently again on each plan. To see that link, the data has to show the pattern inside each combination of region and plan. Rows in one combination don't help much with another, because the relationship there is different.
That second case is where row counts start to matter.
Why combinations add up fast
When a relationship differs between groups, the number that matters is how many combinations your category columns make, and how many rows land in each.
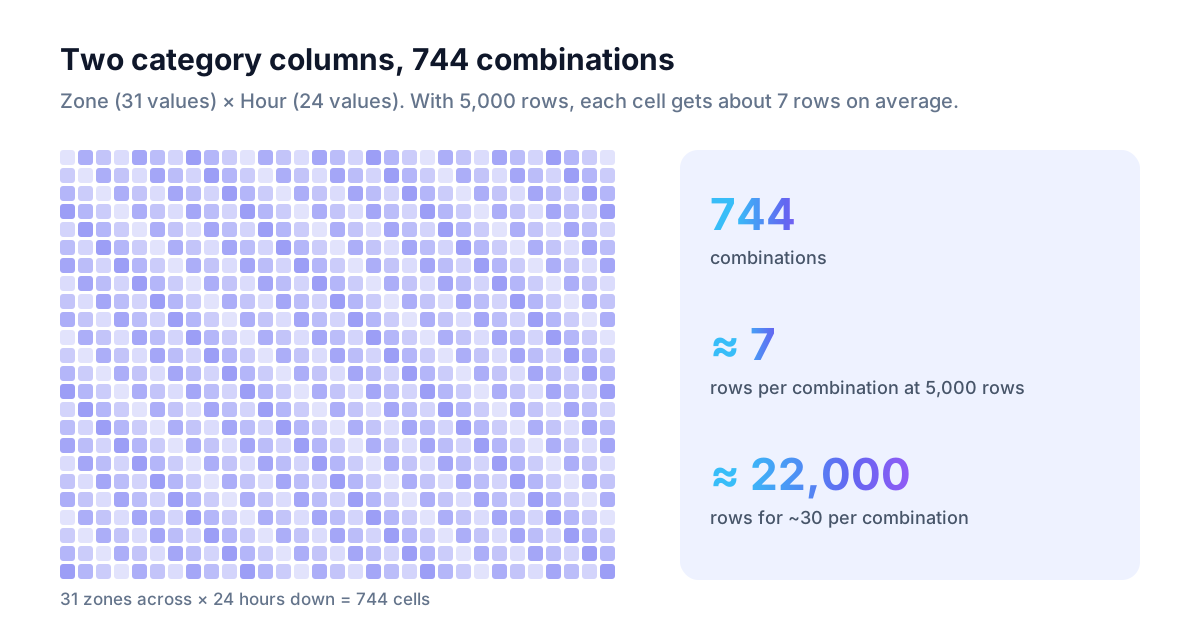
Take two category columns, one with 31 values and one with 24. Together they make 31 × 24 = 744 combinations. With 5,000 rows, that is about 7 rows per combination, on average. Some combinations will have more, many fewer. Seven rows is not much to show a pattern of its own. Add a third many-valued column and the combinations multiply again. A table can feel big and still be thin for this question.
What we measured
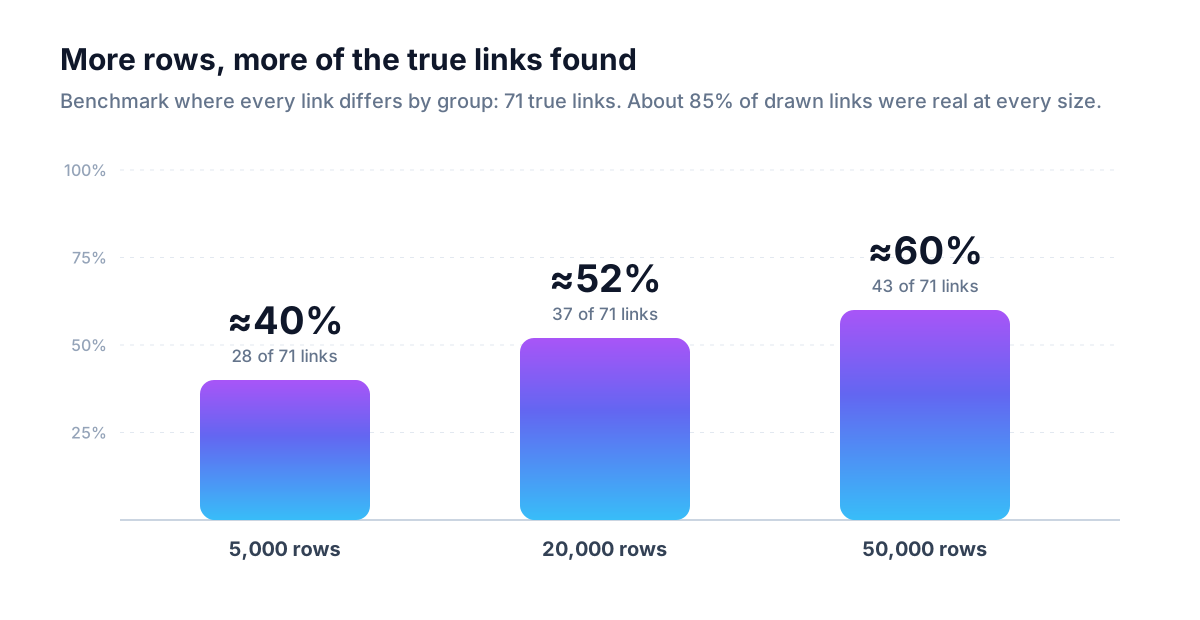
We tested this on a published benchmark network built from air-quality and weather records. It mixes categories, including a zone column with 31 values, a station type with 6, a year with 20, plus month and hour (24 values), with numeric measurements. It has 71 true links, and it is built so that each numeric variable's relationship to the others is different for every combination of its category parents. In other words, it is the hard case above, on purpose.
| Rows | True links found (of 71) | Share found |
|---|---|---|
| 5,000 | 28 | about 40% |
| 20,000 | 37 | about 52% |
| 50,000 | 43 | about 60% |
Two things to take from this:
- More rows help, and the curve is gradual. Going from 5,000 to 50,000 rows recovered 15 more true links.
- What it drew stayed mostly right. Precision was about 0.85 at every size: about 85% of the links DAGsight drew were real. With too few rows, the main failure is missing links, not inventing them.
So a thin dataset of this kind gives you a shorter map, not a wrong one. A drawn link is worth testing; a missing link is weak evidence that nothing is there.
The rule of thumb DAGsight uses
Before a run, DAGsight looks at the two category columns with the most values and multiplies their counts. If your file leaves fewer than about 30 rows per combination, you get a warning, along with a suggested row count: combinations × 30.
For the 31 × 24 example, that means 744 × 30, or roughly 22,000 rows.
Treat 30 as a floor, not a guarantee. In the benchmark above, even 50,000 rows found about 60% of the true links. The warning tells you when you are clearly below the level where group-specific patterns can show up. It doesn't promise that everything will be found above it.
What actually helps
For effects that differ by group, the fix is more rows. In the benchmark, that is what moved the numbers: 5,000 to 20,000 to 50,000 rows took the share of true links found from about 40% to about 52% to about 60%. If you can export a longer history or more of your records, do that first, and use the row count from the warning as your target.
It is tempting to merge groups instead, say cities into regions, to get more rows per combination. For this problem it doesn't work: if an effect really is different in each group, merging the groups averages that difference away instead of revealing it. Merge categories only when the merged version is what you actually want to analyse, not as a way around too few rows.
Two habits help regardless of row count:
- Drop ID-like columns. Customer ID, order number, ticket ID, rep email. A column with a different value on almost every row can't show a pattern.
- Keep dates as dates. A timestamp or date column is more useful kept as a date than broken into dozens of categories. DAGsight reads date columns as time, which also helps it decide the direction of links (we wrote about that in using time to find causal direction).
And keep the other half of the picture in mind: effects that are the same in every group are found well even at modest row counts. A warning about combinations is about the group-specific links, not a verdict on the whole result.
A short checklist
- Count the values in your two most varied category columns and multiply them.
- Divide your row count by that number. Below about 30 per combination, expect missed links where effects differ by group.
- If you can, add rows. Drop ID columns and keep dates as dates either way.
- Read missing links as "not shown by this data", not as "no effect".
- Confirm the links you plan to act on with an experiment.
The full list of what DAGsight assumes, and where it is weaker, is on the assumptions and limits page.
Try it on your own export
Upload your CRM or operations export as a CSV. If the categories are too many for the rows, DAGsight tells you before the run starts and suggests how many rows would help. Free tier, 10 runs, no card: dagsight.com.